Visualization (violin.visualize_violin)
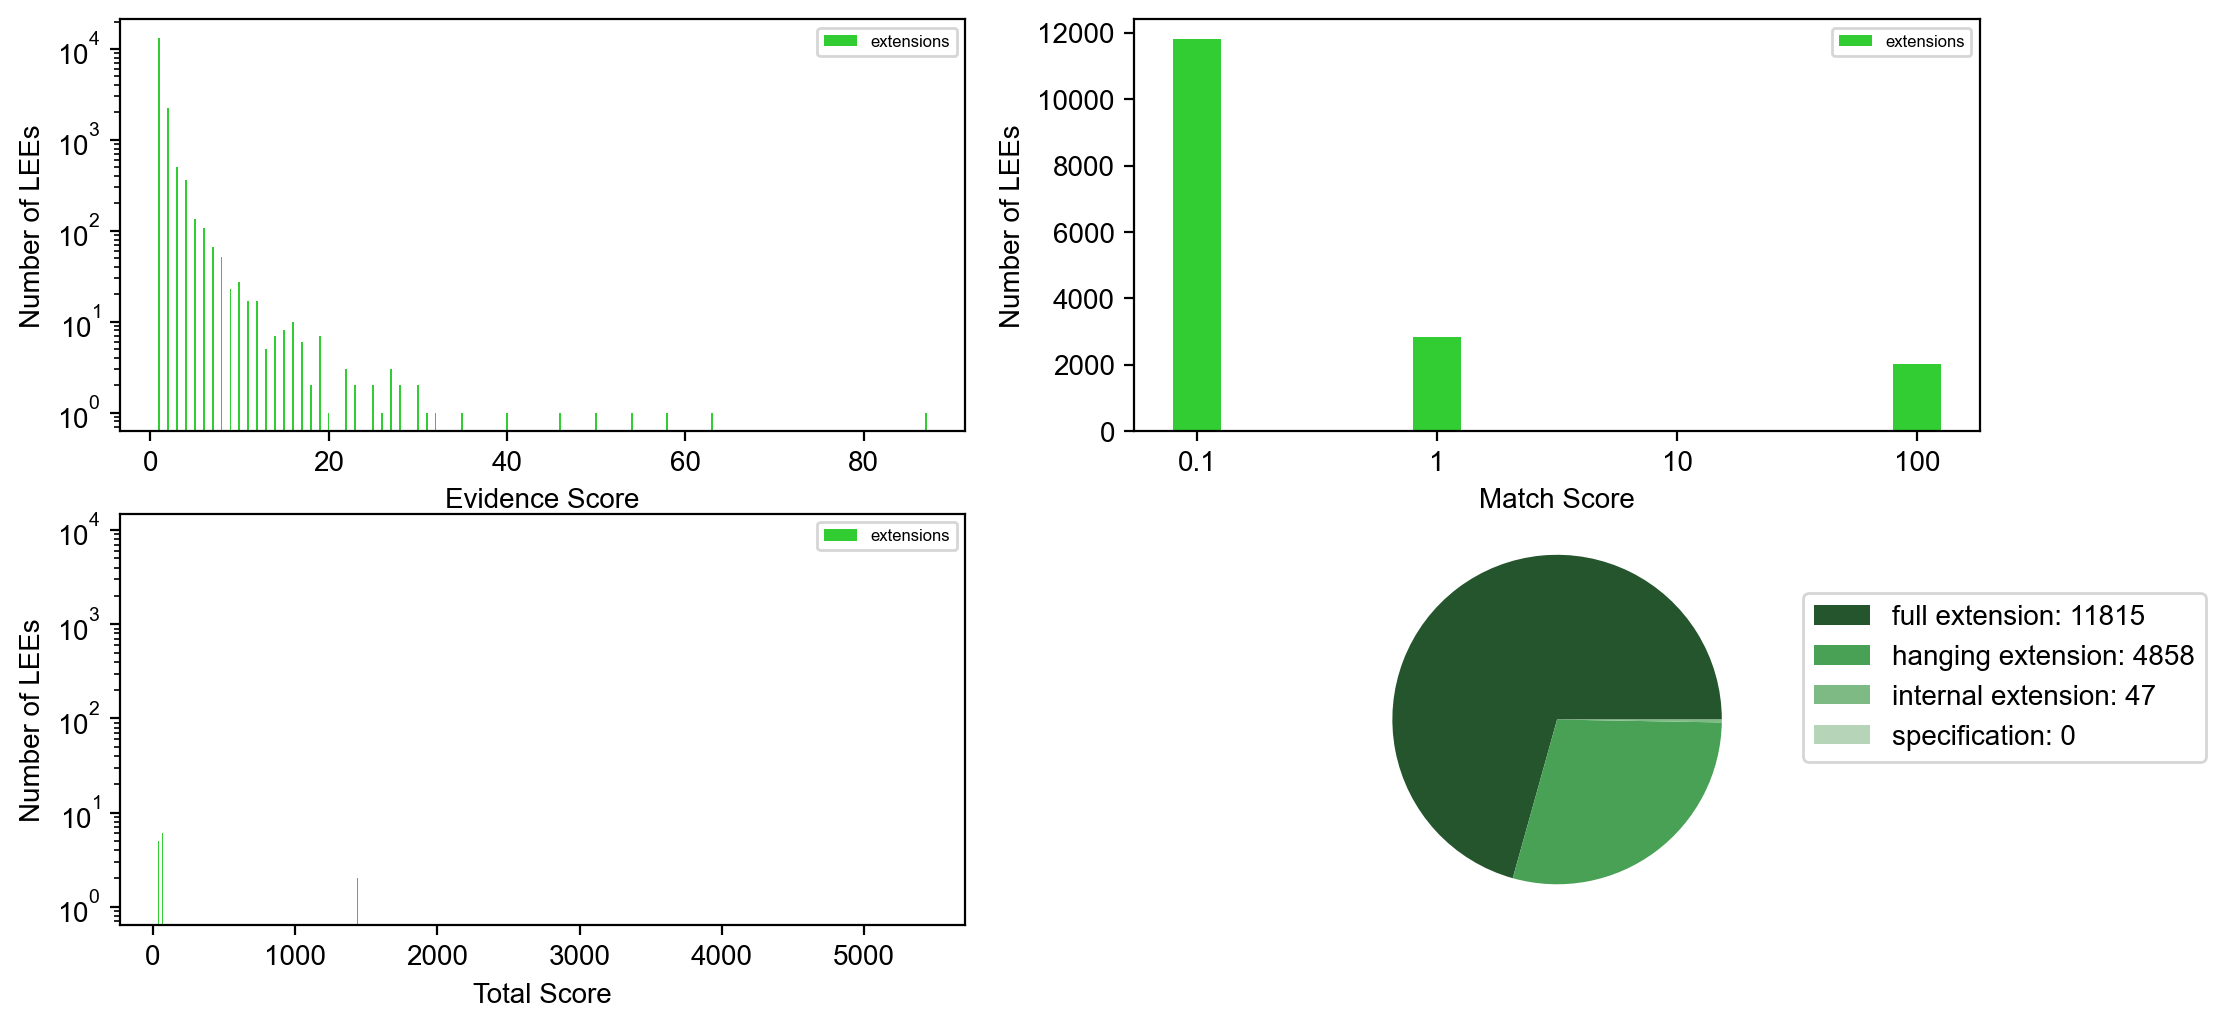
VIOLIN’s visualization function creates a visual summary of the VIOLIN output, incuding total score, evidence score, and match score distributions.
The visualization function includes a filtering option, which can help the user make choices on how to use the VIOLIN output. Visualization can be filtered by three possible metrics:
“%x” : Returns the top X% of LEEs, by Total Score
“Se>y” : Returns all LEEs with an Evidence Score greater than Y
“St>z” : Returns all LEEs with a Total Score grater than Z
When visualizing the total output, this function shows the score distributions by classification, as well as the classification distribution
When visualizing output of a single classification, the classification distribution is replaced by the number of LEEs given that classification
When subcategories are identified in the Kind Score definition, additional plots of subcategory distribution are included
Functions
Dependencies
Python: pandas and matplotlib libraries
VIOLIN: none
Example output
Visualizing the total output
visualize(match_dict, kind_dict, 'RA2_sub_TotalOutput.csv', filter_opt='100%')

Visualizing subcategories:
kind_dict ={"strong corroboration" : 2,
            "weak corroboration1" : 1,
            "weak corroboration2" : 3,
            "weak corroboration3" : 5,
            "hanging extension" : 40,
            "full extension" : 41,
            "internal extension" : 42,
            "specification" : 30,
            "dir contradiction" : 10,
            "sign contradiction" : 11,
            "att contradiction" : 12,
            "flagged1" : 20,
            "flagged2" : 21,
            "flagged3" : 22}
visualize(match_dict, kind_dict, 'RA2_sub_TotalOutput.csv', filter_opt='100%')

Visualizing an individual category (extensions)
visualize(match_dict, kind_dict, 'RA2_sub_extensions.csv', filter_opt='100%')